Setup Details
The Smart Gateway has an internal WiFi network used to configure and manage the gateway. On the bottom of the Smart Gateway unit is a label with the SSID. The SSID starts with JEM and is followed by an string of upper case letters and numbers. The default password is WiFirelay. Once connected open a web browser and go to http://192.168.4.1 and the Setup Details page will appear. Once the Gateway in on the local network, it can be accessed directly using its local network address.
The Setup Details is the home screen and is used to configure the Gateway for connection to the local network, the URL for the monitoring Server, to change reported temperature readings, select the RF receiver channel and monitor the health of the Gateway.
To get the Gateway online and connected to the local network, there are three options. Option 1 is to configure a future connection to the local WiFi. The second option is using the hardwired Ethernet interface. The third option is a Cell Modem plugged into the USB-A port on the back of the Gateway.
The Server is the web service that measurements are sent to, which are normally the JemRF Monitoring Services.
If connecting to JemRF Monitoring Services, the Token is your unique identifier to map the sensor data to your account.
Measurements are taken in centigrade, but there is the option to send temperature readings in Fahrenheit instead.
The RF Receiver Channel # is to support multiple gateways and have sensors only report to the gateway that is on the same channel. Using different channels, (there are 10 channels available) can reduce data collisions if there are lots of sensors in a common area.
The Allow Tech Support is to enable remote tech support from JemRF Support. Internet connection is required. This option enables or disables the private VPN. It requires the Gateway to have Internet access and allows JemRF Support access to work technical issues on the Gateway.
Firmware updates can be automatic, semi-automatic and manual. If the Automatic Update is then the Manual Update option appears. The Update button will bring up Figure 2.
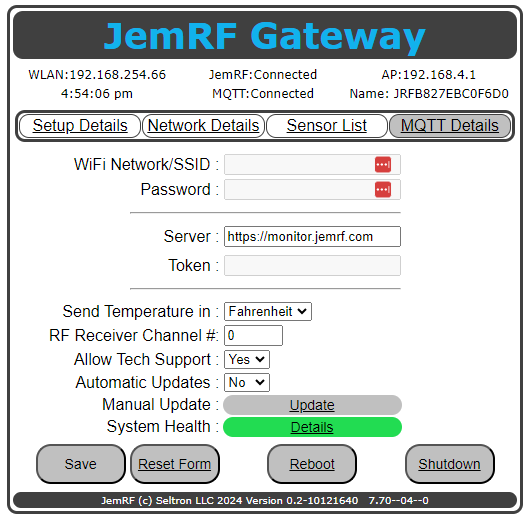 Figure 1 The Setup Details screen.
If the option is No, a second screen appears to pull updates or upload updates to the Gateway manually.
Gateway Updates
There are two methods for updating the Smart Gateway. With Internet Access it can download and install the update, or if offline a laptop can be use to download from the Internet and do the update.
Online Update
If the Smart Gateway has Internet access, pressing the Run Auto-Update Process will tell it to contact the Software Download site, pull the latest release and install it.
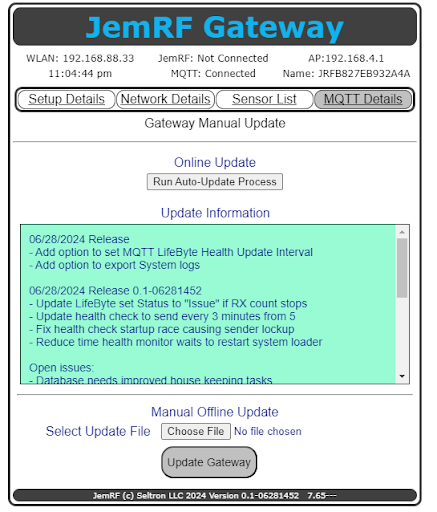 Figure 2 Manual OS Update options.
Update Information
The current release is in the status bar at the bottom of the page. Updates on the latest releases are in the Update Information section. The Gateway must have an Internet connection to show the updated information. Access Update Information History
Manual Offline Update
If the Smart Gateway does not have Intenet Access, then using a computer with Intenet access the current software can be downloaded at Latest Smart Gateway Release
Once downloaded connect to the Smart Gateway using the Smart Gateway AP or the private network it is on and then press the Choose File the will open a window on the local computer to select the current release to be uploaded.
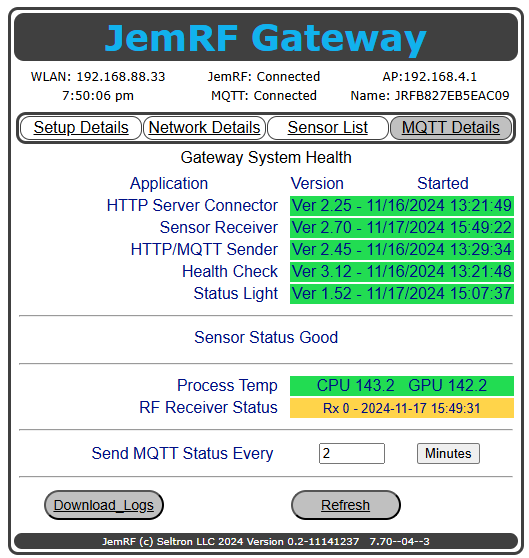
Gateway System Health Page
System Health details: Green indicates the system is working. The Details button shows more details on the System Health shown in Figure 3 and detailed in the Gateway System Health Page.
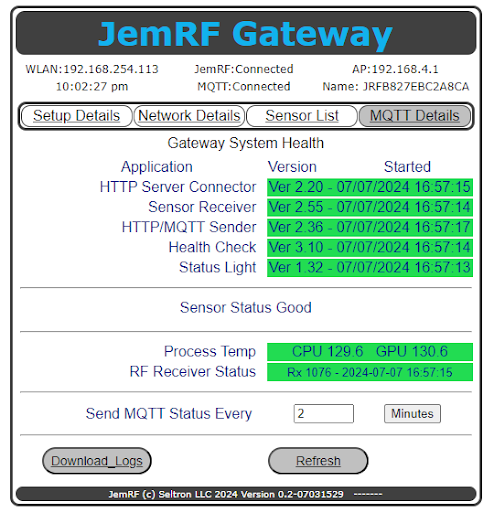 Figure 3 System Health tab.
Gateway System Health so the health of the internal function that makes the Gateway operational. There are four sections on the System Health page to cover all parts of the Gateway operations. The screenshot below shows a healthy Gateway.
Section 1
Five internal control applications perform different functions. The HTTP server connection updates JemRF Monitoring or other remote data collectors service with the Gateway’s health and status. The Sensor Receiver listens for and logs the messages received from the sensors. The receive log contains the date/time the message was received.
The HTTP/MQTT Sender application connects to the JemRF monitoring service or other external server using web services to send measurements. It also handles sending measurements to an MQTT Broker. The Sender also monitors to see if the system’s health status should be sent. If configured, it also sends the MQTT Health Status messages to the MQTT Broker using the MQTT connection.
The Health Check application generates the status used to determine the health of the Gateway. It monitors the message processing, temperatures, and applications to ensure that everything is working correctly.
The Status Light application monitors the Gateway’s health and updates the LEDs with their status. It also controls the external Relay state, which reflects the Gateway’s health.
If any application fails, the Green window will turn Red.
Section 2
Section 2, the Sensor Status section, presents alerts for any sensors that are having issues. This is used to detect an issue with a sensor with low battery power. It has only enough power to make an initial connection but not enough to send measurements. The result is the sensor keeps sending Starting messages that can block measurements from working sensors. The screenshot below shows sensor 93 is having problems. Sensors can generate temporary alerts and then return to normal. A Reset button is provided to clear the list. If a sensor reappears, it should be taken off-line and checked.
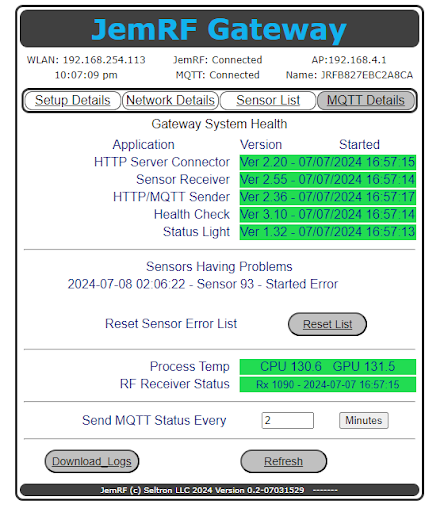
**Figure 4 System Health tab showing that Sensor 93 is having issues.**
Section 3
The third section of the Health page shows the internal temperatures of the Processors (Process Temp). The system will generate a fault warning and the display will turn Yellow when the temperatures emceed 160°F and Red when the temperature reaches 170°F. System will shutdown at 175°F.
The RF Receiver Status shows the current count of messages processed. This is the same total count shown at the bottom of the Sensor List page. It also shows a restart date for the RF processor if an error is detected, and the RF receiver has to be reset. If this date differs from the Sensor Receiver date time it could indicate an internal error was corrected.
Receive Data Status
When no data has been received by the Gateway in over 20 minutes and all other features are working the RF Receive Status will turn from Green to Orange. The image below show the status the Health Status page with the Warning Color on the Rx Status Page.
Section 4
The last section (Send MQTT Status) enables sending system health messages to the MQTT Broker for remote monitoring. A zero (0) disables the function. The value is in minutes. The full set of system health messages is sent on the initial connection. After that, only the health messages indicating a change in status are sent.
Changes in status include:
- Internal applications failing or restarting.
- Internal CPU Temperatures above warning limit
- No data being processed for 6 minutes
- Connection to the HTTP or MQTT server is lost