Introduction to JemRF Monitoring System
JemRF Monitoring (Monitoring) delivers a professional, scalable monitoring solution designed to meet the needs of businesses and organizations of all sizes. The system is built on three essential components:
The Sensor: Is the device that measures and monitors environmental conditions, such as the temperature in specific areas like doors, refrigerators, freezers, or water pipes.
The Gateway: The sensor transmits collected data to a Gateway, which logs the information, appends a timestamp and location code, and forwards it to the monitoring system.
The Cloud Monitoring System: The user interface, the cloud platform provides real-time monitoring, allowing users to set alerts for out-of-tolerance conditions and visualize historical data with intuitive plotting tools.
Features of JemRF Monitoring:
Monitoring: The viewing of detailed measurements for each sensor. Visual Indicators: Graphic icons display door, window, and switch states (open or closed). Cross-Device Compatibility: Access your monitoring dashboard seamlessly from desktops, tablets, and most smartphones.
Getting Started
Create an Account
If you have not created an account, for the instructions Click here to Create an Account.
The cloud Monitoring provide a free accounts with every purchase to get started. With services available and adaptable for operating from multiple locations. Part of registration is entering your business information, managing who can access your information and much more.
If you have not created an account but are part of existing JemRF customer, the easy option is to have an existing user login to the JemRF Customer Portal and Invite you to join their account.Click here for details on Inviting a user
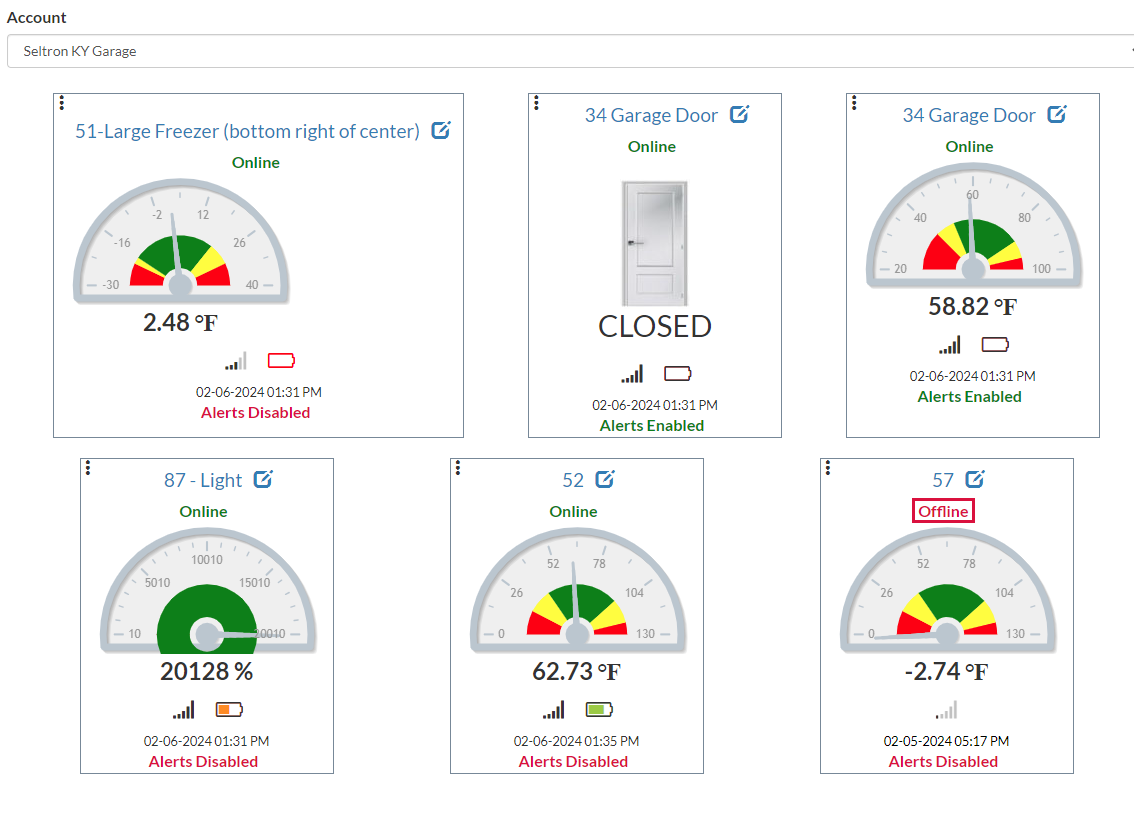
Dashboard
After you have created an account and logged in, Monitoring starts by resenting the user with their Dashboard. The Monitoring site works on desktops, tablets and most phones. It shows a graphic scale for each of your temperature sensors. It also provide graphic icons to show doors, windows and switches in open and closed states.
The Sensors
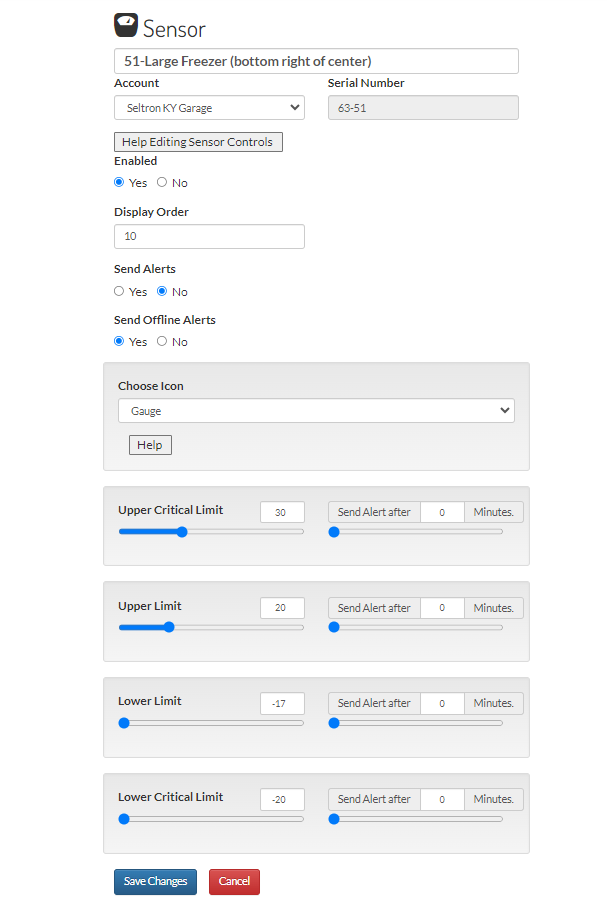
The Sensor tab is used to set the alarm alerts values for upper and lower limits.
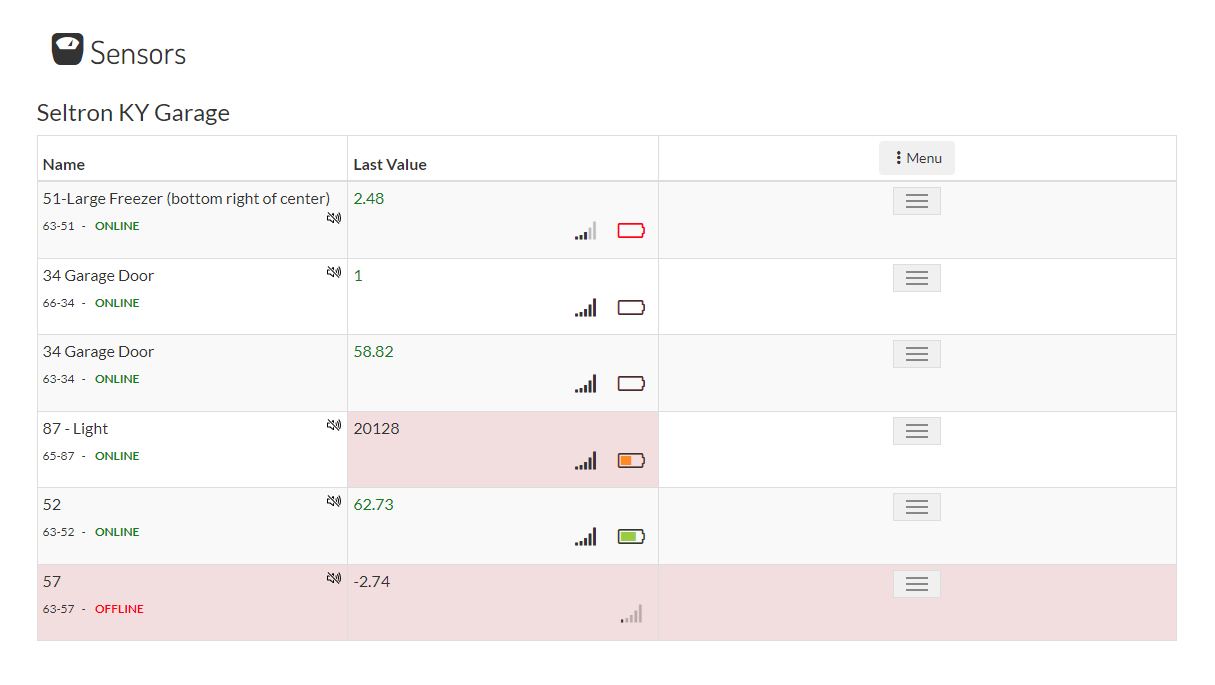
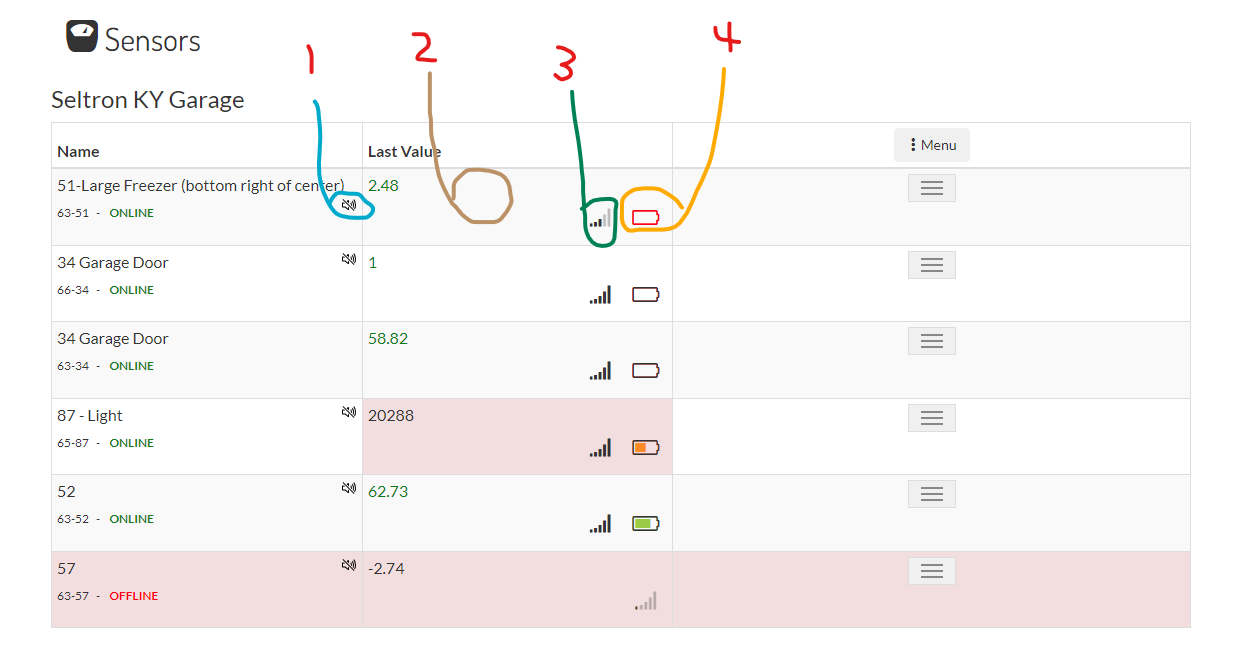
The Sensor tab details
- Shows if the sensor alarms have been muted
- Shows an Icon when you move the mouse pointer over that spot, to Plot the Sensor.
- Shows an Icon for the Signal Strength of that sensor by the receiver.
- Shows an Icon of a battery at different levels, mousing over the Icon will show last reading.
Access the Sensor Edit
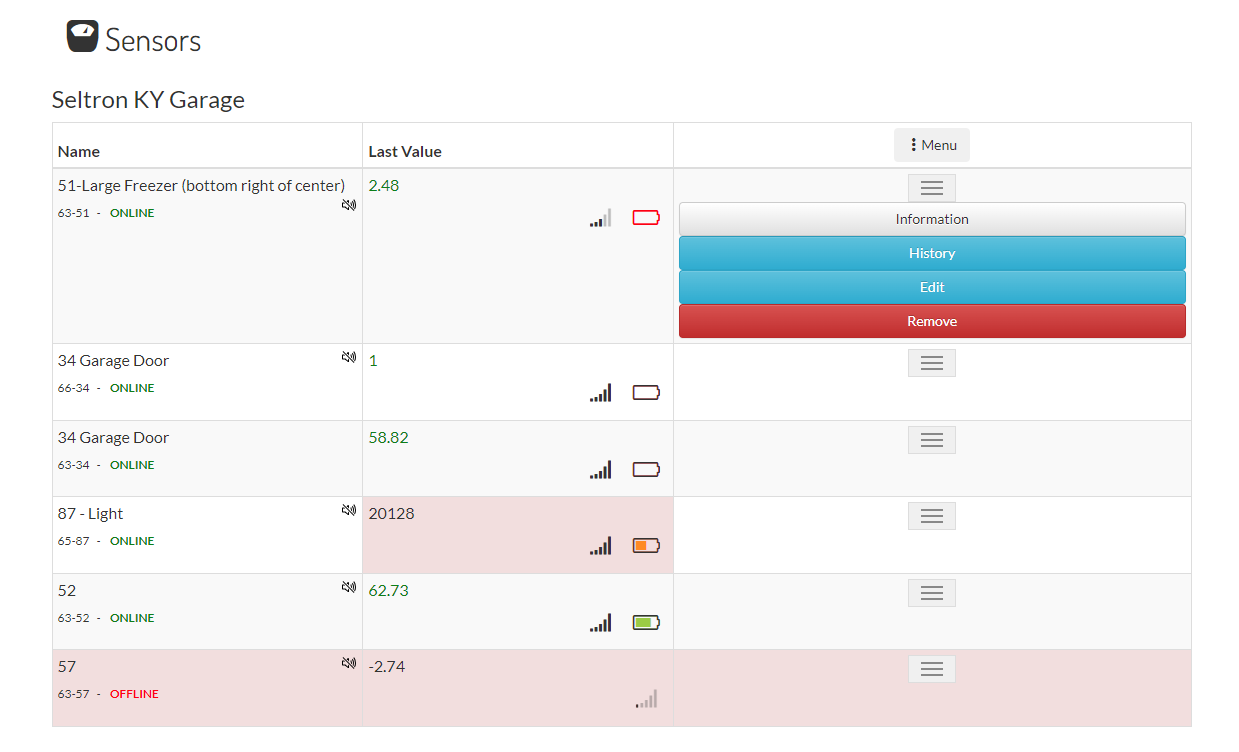
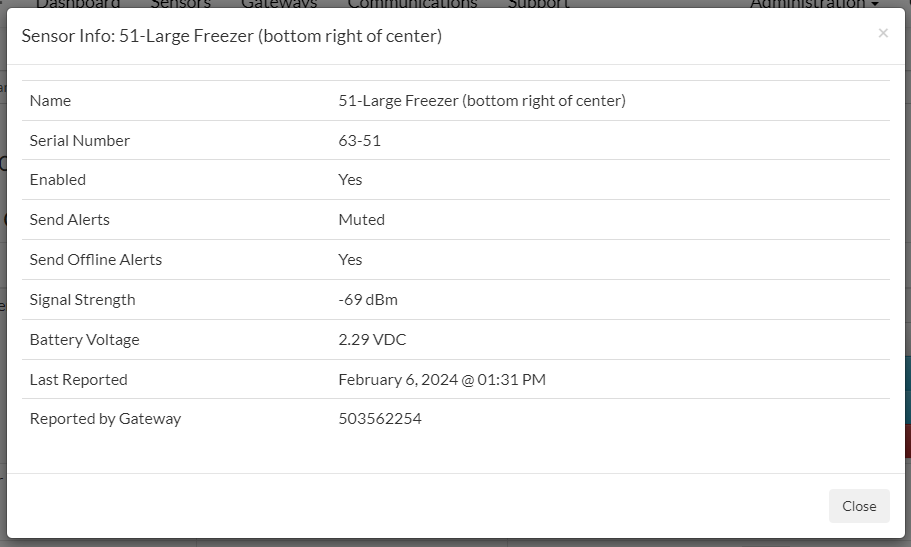
Selecting the Sensor Information tab will show
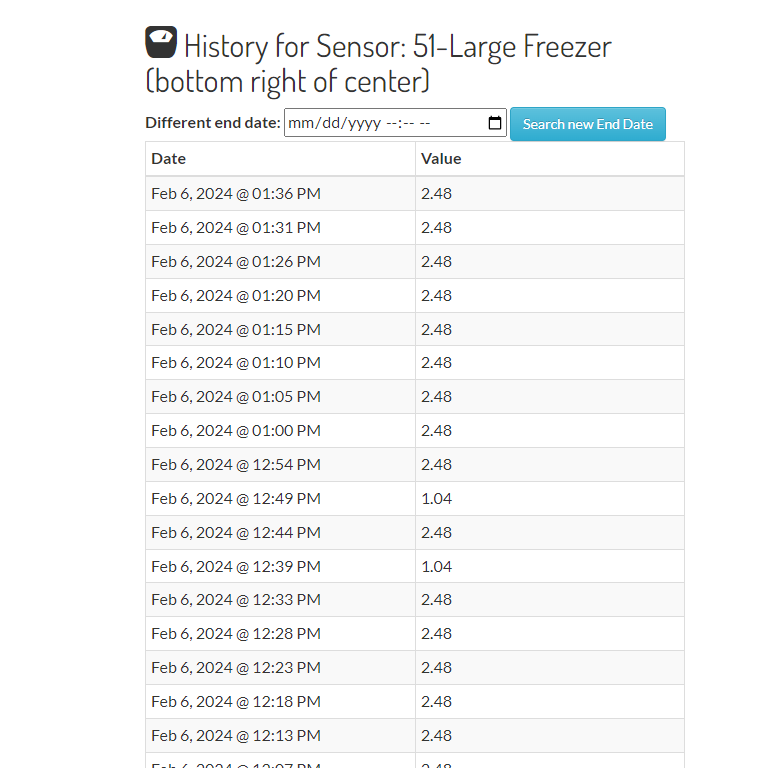
Selecting sensor History will show the actual readings for the last few hours
The Edit button shows an edit window to change the sensor parameters.
Gateway
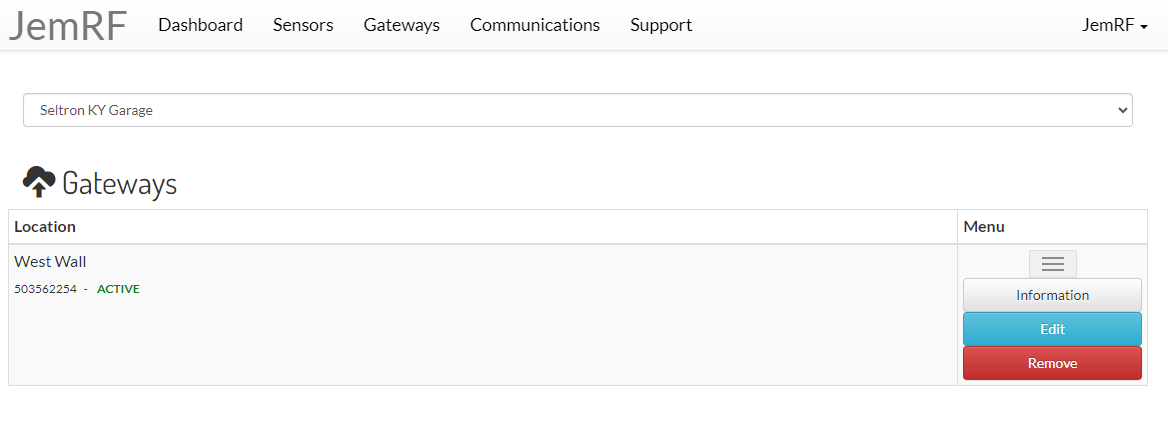
Selecting the Gateway Tab at the top will present a list of know Gateways for that account.
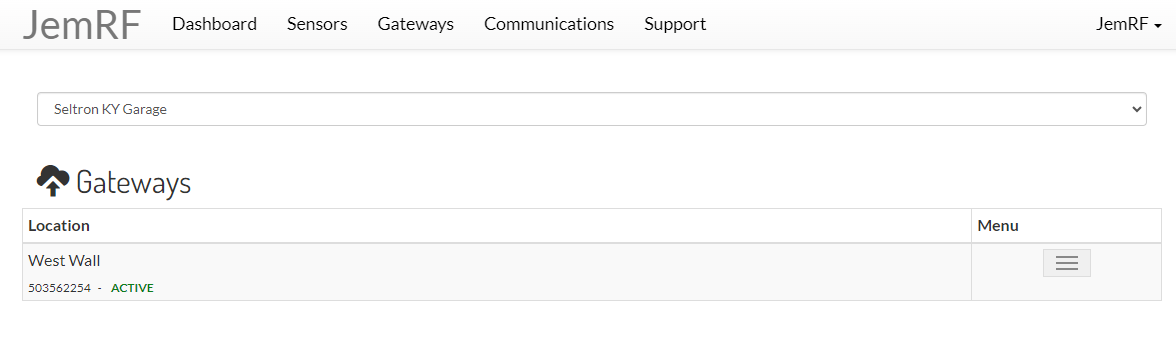
The menu button will list the option for the gateway.
- Show Gateway Information
- Edit the Gateway Settings
- Remove the Gateway from the account list
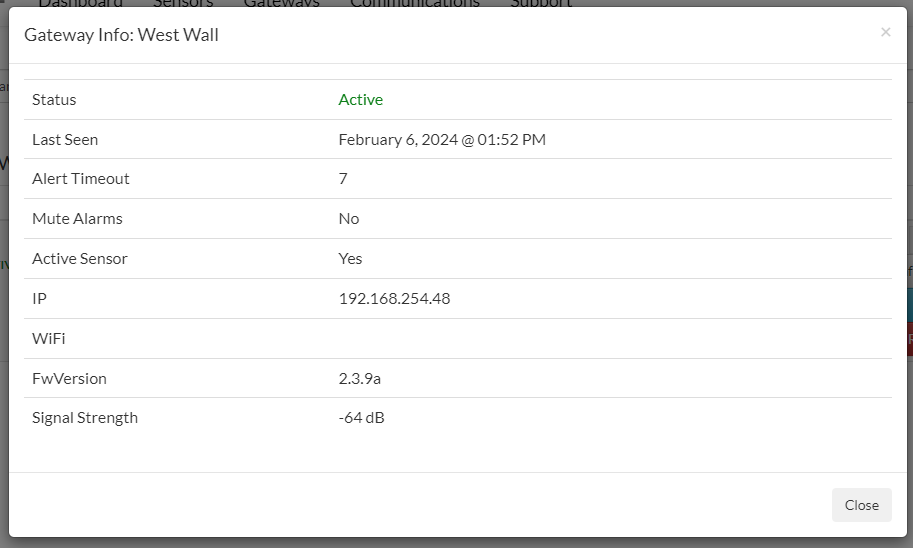
The Gateway Information shows:
- Status Active/InActive
- When was the last time the Gateway did a Check-in
- The Alert Timeout is how many minutes is a Gateway or Sensor reports in before it is flagged as Off-line
- Mute Alarms Yes/No is messages when the Gateway goes On or Off line
- Active is a control to disable alerts and updates on about that Gateway
- The remaining Items, IP Address, WiFi, FmVersion and Signal Strength are diagnostic information about that Gateway.
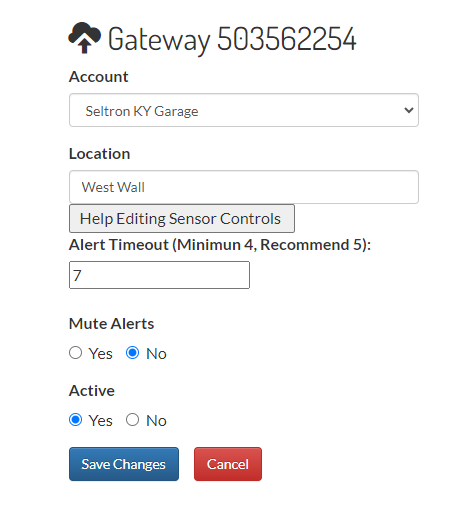
The Edit option will allow you to move the Gateway to another account (if you manage more that one).
- You can Assign or Edit the Location information for that Gateway
- The Alert Timeout is used to trigger an Offline event for the Gateway or Sensors being processed by that Gateway. The default Alert Timeout is 5 minutes. The value should be twice the normal checking time for a sensor plus one minute. An example would be for sensors that check-in every 10 minutes the timeout should be 21 minutes. That will allow one updated to be missed and not trigger an Offline alert until the second message is not received. Your environment my need different settings.
- You can have On/Off line messages for the Gateway Muted.
- You can disable all reporting on the Gateway by setting Active to No.
Communications
Selecting the Communication tab will present the current list of people contacted on and events in their account(s),
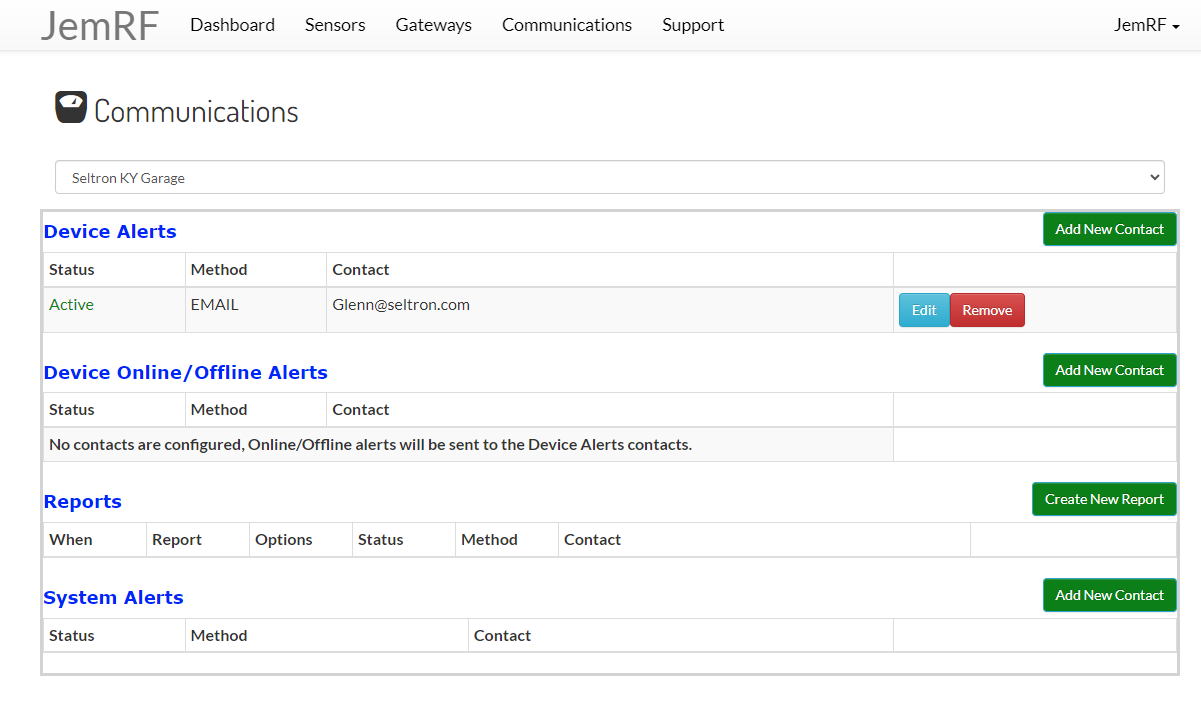
- Device Alerts is used to assign who gets the Alerts when a Sensor exceeds it limits. That person does not need an account on the system to be in the list.
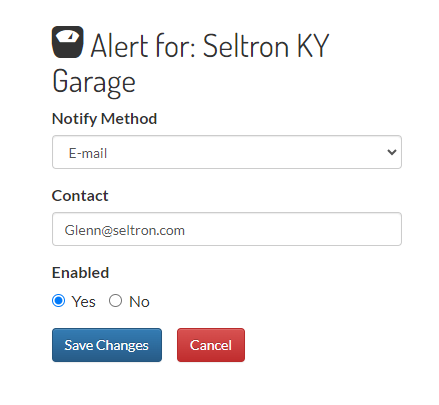
- Device Online/Offline Alerts is used to assign who gets notified when the device goes Offline and comes back Online. If no contacts a in this list, the Device Alert contacts get notified. This is useful for automated system to handle Device limits but not have to process On/Offline changes.
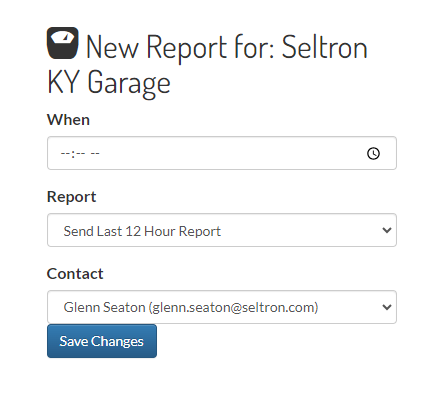
- Monitoring generates a Summary Report for all the sensors in the account. This lets you assign who gets the summary. You select the contact, when you want the summary and if you want the summary for the last 12 hours or last 24 hours.
- System Alerts is the contact assigned to get Server broadcast messages, such as system down-time event, or update event. If no one is assigned, no one gets notified for that account.
Tips on Monitoring
When setting monitoring, most installation will require some tuning before going live with monitoring. For example most coolers have unique custom temperature swings. So setting the upper and lower alert values may also include time above or below the limits before sending alerts.